Shin Kim is working on a new SaaS startup and is also chief of staff to entrepreneur Elad Gil . Previously, Shin was at Oak Hill Capital and J.P. Morgan and earned a Master’s in EECS (data science) from UC Berkeley.
More posts by this contributor
With the recent emphasis on Uber and WeWork, much media attention has been focused on high-burn, “software-enabled” startups. However, most of the IPOs of the last few years in tech have been in higher capital efficiency software-as-a-service startups (SaaS).
In the last 30 months (2017 2H onwards), a total of 21 U.S.-based, VC-backed SaaS companies have gone public, including Zoom, Slack, Datadog and others1. I analyzed all 21 companies to understand their fundraising and revenue-generating trajectories. A deep dive into the individual companies’ trajectories can be found in this Extra Crunch article.
Here are the summary takeaways from this data set:
1. At IPO, total capital raised2 was slightly ahead of annual run-rate revenue (ARR)3 for the median company

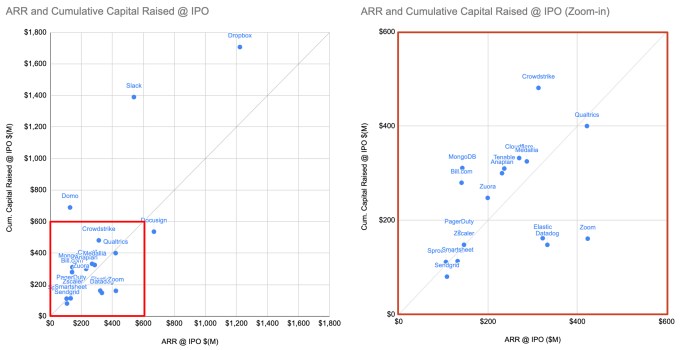
Here is a scatterplot of the ARR and cumulative capital raised at the time each company went public. Most companies are clustered close to the diagonal line that represents ARR and capital raised matching each other. Total capital raised is often neck-and-neck or slightly higher than ARR.
For example, Zscaler raised $148 million to get to $146 million of ARR at IPO and Sprout Social raised $112 million to get to $106 million of ARR.
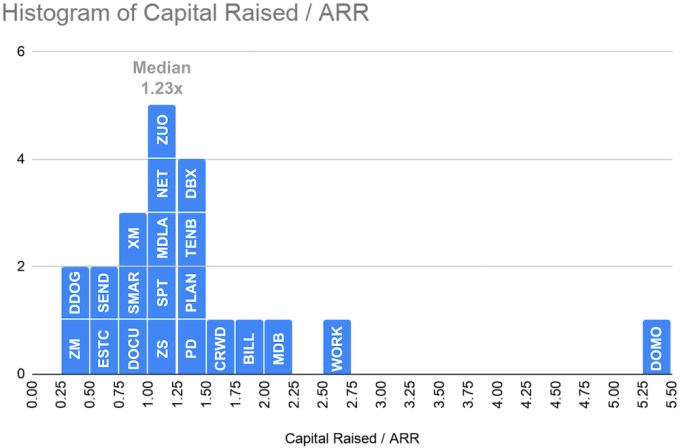
It is useful to introduce a metric instead of looking at gross dollars, given the high variance in revenue of the companies in the data set — Sprout Social had $106 million and Dropbox had $1,222 million in ARR, a 10x+ difference. Total capital raised as a multiple of ARR normalizes this variance. Below is a histogram of the distribution of this metric.

The distribution is concentrated around 1.00x-1.25x, with the median company raising 1.23x of ARR by the time of its IPO.
There are outliers on both ends. Domo is a profligate outlier that had raised $690 million to get to $128 million of ARR, or 5.4x of ARR — no other company comes remotely close. Zoom and Datadog are efficient outliers. Zoom raised $161 million to get to $423 million of ARR and Datadog raised $148 million to get to $333 million of ARR, both representing only 0.4x of ARR.
2. Cash burn is a more accurate measure of capital efficiency and may diverge significantly from capital raised (depending on the company)
How much capital a company raised tells only half of the story of capital efficiency, because many companies are sitting on a significant cash balance. For example, PagerDuty raised a total of $174 million but had $128 million of cash left when it went public. As another example, Slack raised a total of $1,390 million prior to going public but had $841 million of unspent cash.
Why do some SaaS companies end up seemingly over-raising capital beyond their immediate cash needs despite the dilution to existing shareholders?
One reason might be that companies are being opportunistic, raising capital far ahead of actual needs when market conditions are favorable.
Another reason may be that VCs that want to meet ownership targets are pushing for larger rounds. For example, a company valued at $400 million pre-money may only need $50 million of cash but could end up taking $100 million from a VC that wants to achieve 20% post-money ownership.
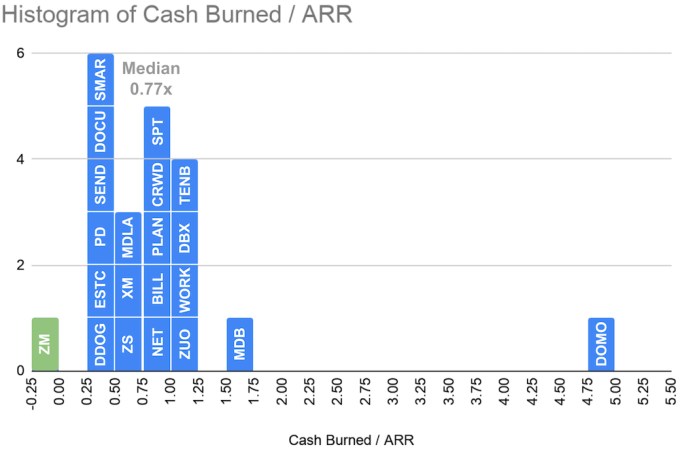
These confounding factors make cash burn — calculated by subtracting the cash balance from total capital raised4 — a more accurate measure of capital efficiency than total capital raised. Here is a distribution of total cash burn as a multiple of ARR.

Remarkably, Zoom achieved negative cash burn, meaning Zoom went public with more cash on its balance sheet than all of the capital it raised.
The median company’s cash burn at IPO was 0.77x of ARR, quite a bit less than the total capital raised of 1.23x of ARR.
3. The healthiest SaaS companies (as measured by the Rule of 40) are often the most capital-efficient
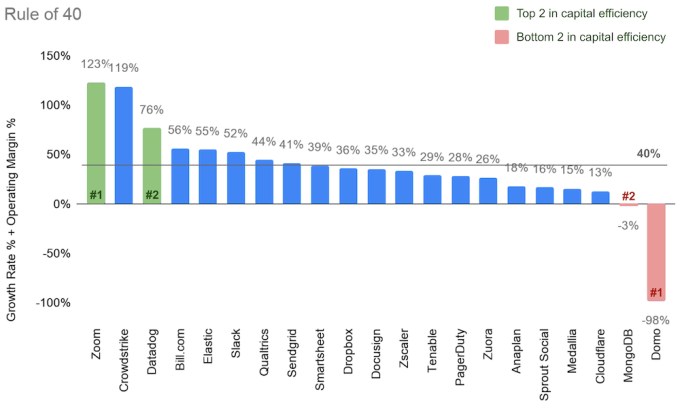
The Rule of 40 is a popular heuristic to gauge the business health of a SaaS company. It asserts that a healthy SaaS company’s revenue growth rate and profit margins should sum to 40%+. The below chart shows how the 21 companies score on the Rule of 405.

Among the 21 companies, eight companies exceed the 40% threshold: Zoom (123%), Crowdstrike (119%), Datadog (76%), Bill.com (56%), Elastic (55%), Slack (52%), Qualtrics (44%) and SendGrid (41%).
Interestingly, the same outliers in terms of capital efficiency as measured by cash burn, on both extremes, are the same outliers in the Rule of 40. Zoom and Datadog, which have the highest capital efficiency, score the highest and third highest on the Rule of 40. And inversely, Domo and MongoDB, which have the lowest capital efficiency, also score lowest on the Rule of 40.
This is not surprising, because the Rule and capital efficiency are really two sides of the same coin. If a company can sustain high growth without sacrificing profit margins too much (i.e. score high on the Rule of 40), it will over time naturally end up burning less cash compared to peers.
Conclusion
To apply all of this to your favorite SaaS business, here are some questions to consider. What is the total capital raised in multiples of ARR? What is the total cash burn in multiples of ARR? Where does it stack compared to the 21 companies above? Is it closer to Zoom or Domo? How does it score on the Rule of 40? Does it help explain the company’s capital efficiency or lack thereof?
Thanks to Elad Gil and Denton Xu for reviewing drafts of this article.
Endnotes
1Only includes U.S.-based, VC-backed SaaS companies. Includes Quatrics, even though it did not go public, as it was acquired right before its scheduled IPO.
2Includes institutional investments prior to the IPO. Does not include founders’ personal capital investment.
3Note that this is not annual recurring revenue, which is not a reporting requirement for public companies. Annual run-rate revenue is calculated by annualizing quarterly revenue (multiplying by four). The two metrics will track closely for SaaS businesses, given that SaaS revenue is predominantly recurring software subscriptions.
4This is a simplified definition as it will capture non-operational uses of cash such as share repurchase from founders.
5Revenue growth is calculated as the growth rate of the revenue during the last 12 months (LTM) over the revenue during the 12 months prior to that. Profit margins are non-GAAP operating margins, calculated as operating income plus stock-based compensation expense divided by revenue over the last 12 months (LTM).


